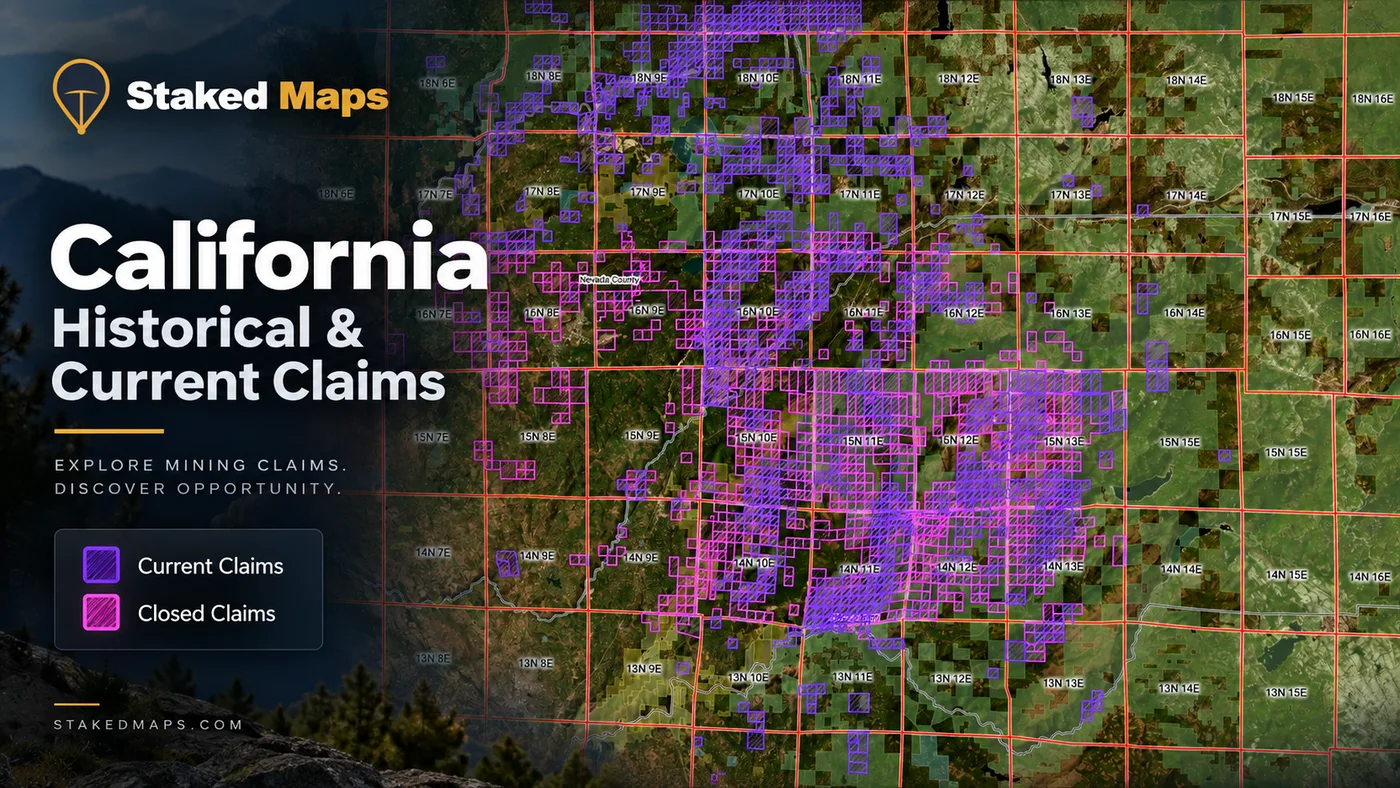
California Mining Claims Map & Current BLM Claim Data
California's current federal mining-claim landscape extends far beyond the famous Mother Lode. Staked Maps combines current and historical BLM claim records, surface-management information, and documented mineral occurrences in one interactive map so you can research an area before heading into the field. Use the data below to see where current records are concentrated, how BLM claim statuses differ, and what California-specific rules may affect prospecting and collecting.
Free account · No credit card required · Opens directly to the California map
28,839
Current / Not-Closed Federal Records
312,816
Historical / Closed Records
San Bernardino County
Most Current Records
60.3%
Of Current Records in the Top 3 Counties
California's Modern Mining Claim Map Looks Very Different From the Gold Rush Map
California is famous for the Sierra Nevada Gold Rush, but today's federal claim record tells a broader story. As of September 22, 2026, Staked Maps tracks 28,839 current/not-closed federal mining claim and site records across California.
San Bernardino County currently has the largest concentration, with 12,471 records, or 43.2% of California's statewide current total. The three highest-activity counties — San Bernardino County, Inyo County, and Imperial County — together account for 17,383 records, or 60.3% of the statewide total.
This modern pattern differs from California's popular association with Sierra Nevada Gold Rush districts such as the Mother Lode counties. San Bernardino County, Inyo County, and Imperial County are desert counties in the state's southern and eastern regions, not the historic Sierra Nevada foothill counties most associated with 1849. Historic Gold Rush foothill counties currently hold far fewer current/not-closed records by comparison — see the full county table below for exact current figures for every county. Claim concentration reflects where current federal mining claim and site records are recorded today, not necessarily where historic mining occurred, where minerals are richest, or where active production is taking place.
Claim concentration shows where federal claim records are clustered. It does not establish mineral quality, production, public access, or whether unclaimed-looking land is open to mineral entry.
How Many California Mining Claims Are Actually Active?
Not every current BLM record is labeled Active. Federal claim records can carry several current statuses, and treating every not-closed record as an "active claim" hides an important distinction. Staked Maps preserves the underlying BLM status so you can see what the federal record actually reports.
BLM Status
Records
Share of Current Records
Active
13,883
48.1%
Filed
14,783
51.3%
Under Review
157
0.5%
Pending
1
<0.1%
Submitted
15
0.1%
Why this matters: Staked Maps uses current/not-closed when referring to the entire group above. We reserve Active for records whose BLM status is actually Active. A status shown in BLM records should still be independently verified before making filing, access, staking, or other legal decisions.
California Lode, Placer, Mill & Tunnel Sites
California's federal mining record includes more than lode and placer claims. BLM also recognizes mill sites and tunnel sites, and those records must be included when they are present in the statewide total.
15,265
Lode Claims
11,172
Placer Claims
2,379
Mill Site Claims
23
Tunnel Site Claims
Lode claims generally cover valuable mineral deposits occurring in rock in place. Placer claims generally cover valuable mineral deposits occurring in loose material rather than a vein or other deposit in place. Mill sites and tunnel sites serve different purposes under federal mining law and should not be counted as lode or placer claims. See the official BLM Mining Claims resource.
California Claims by Type, Visualized
Claim Type
Current Claims
Lode Claims
15,265 (52.9%)
Placer Claims
11,172 (38.7%)
Mill Site Claims
2,379 (8.2%)
Tunnel Site Claims
23 (0.1%)
Explore California Mining Claims on the Map
Numbers are useful, but location is what makes the data practical. The Staked Maps California map lets you view current claim records alongside historical claims, surface-management information, and other research layers so you can investigate an area before heading into the field.
See what's recorded. View current federal mining claim and site records and open individual records for additional details.
Add land context. Compare recorded claim activity with available surface-management information instead of researching each layer on a separate site.
Take your research into the field. Paid plans add offline map downloads and additional research tools for areas where cell service is unreliable.
Free account · No credit card required · Opens directly to California
Important: No claim shown does not mean open to claim
A gap between mapped mining claims does not prove that land is open to mineral entry. Mineral ownership, withdrawals, wilderness designations, existing rights, land status, and other restrictions can affect whether a new mining claim may legally be located. Verify current land and mineral status through the appropriate BLM records and office before attempting to stake a claim.
See where California's current claim records are located
Open the free California map to inspect recorded claims alongside surface-management boundaries.
The table shows California's 10 counties with the most current records. Separately, 831 records in the statewide total cannot currently be assigned to a specific county because their BLM source geometry is incomplete or unresolved.
San Bernardino County currently contains the largest share of California's mapped current claim/site records, followed by Inyo County and Imperial County. Together, San Bernardino County, Inyo County and Imperial County account for 60% of the statewide total. Lode records make up 52.9% of current claims statewide and placer records 38.7%, with the remaining 8.3% recorded as tunnel or mill sites. San Bernardino County has both the most lode and the most placer records. Claim density alone does not establish mineral potential or whether nearby ground is open to location, but it provides a useful starting point for researching where mining activity is concentrated.
What the County Data Tells Us
San Bernardino County, Inyo County, and Imperial County dominate California's current federal mining claim and site records, together accounting for 60.3% of the statewide total. San Bernardino County alone holds 43.2% of all current records in California. Plumas County and Kern County round out the next tier of activity.
This distribution stands in contrast to California's popular association with Sierra Nevada Gold Rush counties. Historic Mother Lode counties in the Sierra Nevada foothills each hold a small fraction of the statewide current total by comparison — see the full county table below for exact current figures for every county, including the historic foothill counties. Southern and eastern desert counties, not the historic Sierra Nevada foothill counties, currently account for the majority of California's recorded federal mining claim and site activity.
These numbers measure federal claim and site records, not producing mines or proven mineral reserves.
Remaining California Counties With Current Mining Claim Records
California's Mining Regions: From the Mother Lode to the Mojave
California's mining history and geology vary dramatically from one part of the state to another. The regions below provide context for the modern claim data, but historical mineral activity should not be confused with current land access, claim availability, or permission to prospect.
Mother Lode & Sierra Nevada Foothills
The Sierra Nevada foothills are California's best-known historic gold region. The 1848 discovery at Sutter's Mill helped trigger the California Gold Rush, while placer mining spread through major river systems and hard-rock mining developed across the broader Mother Lode region. Today, historic importance does not automatically translate into the state's highest concentration of current federal claim records, which is why modern BLM data should be evaluated alongside mining history rather than replaced by it.
Klamath Mountains & Northern California
Northern California's Klamath Mountains and river systems have long histories of placer and hard-rock mineral exploration. Rivers and tributaries across this region became important parts of California's historic mining landscape. Modern prospectors should treat that history as research context and use current claim records, land status, access information, and local regulations to determine what can actually be investigated today.
Eastern California
Eastern California contains historic mining districts, desert mountain ranges, and extensive areas of federal mineral estate. Inyo and neighboring eastern counties appear very differently on a modern claims map than California's better-known Gold Rush foothill districts. Current claim counts on this page should be used to identify where federal records are concentrated, while California Geological Survey and BLM resources provide additional geological and land-status context.
Mojave & Southern California Deserts
Southern California's desert counties are an important part of the state's modern federal mining-claim landscape. Historic hard-rock districts, dry placer areas, industrial-mineral resources, and large areas of federal mineral estate all contribute to the region's mining history. The current county rankings above show how prominent these desert counties are in today's BLM record without assuming that claim density proves mineral quality or current production. San Bernardino County alone accounts for 43.2% of California's current federal claim and site records shown above.
Does BLM Land Mean You Can Stake a Mining Claim in California?
No.
Seeing BLM-managed surface land on a map does not automatically mean that a new mining claim may be located there. BLM states that mining claims may be located on public or National Forest System land only where the federal mineral estate is open to mineral entry. Land can be withdrawn or otherwise closed to new claim location even when it is federally managed.
This distinction is especially important in California. BLM reports that it oversees about 15 million acres of public surface land in California and 47 million acres of subsurface mineral estate. Surface management and mineral ownership are therefore not the same thing.
National parks, certain national monuments, wilderness areas, wildlife areas, military reservations, some Wild and Scenic River corridors, and other withdrawn lands can be closed or restricted under federal law. Private surface land can also overlie federal mineral estate in some situations.
Use the map to research. Use official records to verify.
Staked Maps helps you see recorded claim activity and land context in one place. It does not make a legal determination that a parcel is open to mineral entry, available for claim location, accessible across surrounding property, or free of other rights and restrictions.
California Gold Prospecting Rules You Need to Know
California prospecting rules depend on the activity, land manager, location, existing mining rights, environmental restrictions, and local conditions. The rules below are a starting point for research, not a substitute for checking the requirements for the exact place you intend to visit.
Activity
California Overview
Gold panning
May be allowed depending on the land manager and location. Site-specific restrictions still apply.
Suction dredging
Currently prohibited and unlawful throughout California.
Recreational rock and mineral collecting on BLM land
Generally allowed for personal use where collecting is not otherwise restricted, subject to BLM limits and conditions.
California State Parks
Different rules apply. Panning and rockhounding are only allowed where the applicable park rules permit them.
Motorized or mechanical collecting
Restrictions apply. BLM's California recreational-collection rules do not authorize motorized or mechanical devices for ordinary personal-use specimen collecting.
Is suction dredging legal in California?
No. The California Department of Fish and Wildlife currently states that the use of vacuum or suction dredge equipment is prohibited and unlawful throughout California. CDFW also states that it is currently prohibited from issuing suction-dredging permits under the Fish and Game Code. This applies to mechanized or motorized systems used to remove, assist in removing, or process material from the bed, bank, or channel of a river, stream, or lake to recover minerals.
How much rock or mineral material can you collect on California BLM land?
BLM California states that qualifying rocks, minerals, and semiprecious gemstones may generally be collected for personal, noncommercial use in reasonable quantities where collecting is not prohibited or restricted. California BLM defines that personal-use limit as up to 25 pounds per day plus one piece, with a total limit of 250 pounds per year. Additional restrictions apply, including limits on where collecting is allowed and a prohibition on using motorized or mechanical devices for ordinary recreational collection.
California State Parks uses different rules from BLM. For example, the department's published gold-panning guidance describes "hands and pans" rules where panning is permitted and limits one person to 15 pounds of mineral material per day under the applicable rockhounding regulations. Do not assume rules for BLM land apply inside a California State Park. Check the individual park before collecting or panning.
Regulatory content last reviewed September 14, 2026. This date reflects when Staked Maps last checked these sources — it is not updated automatically with each build.
California Mineral Occurrences & Rockhounding Research
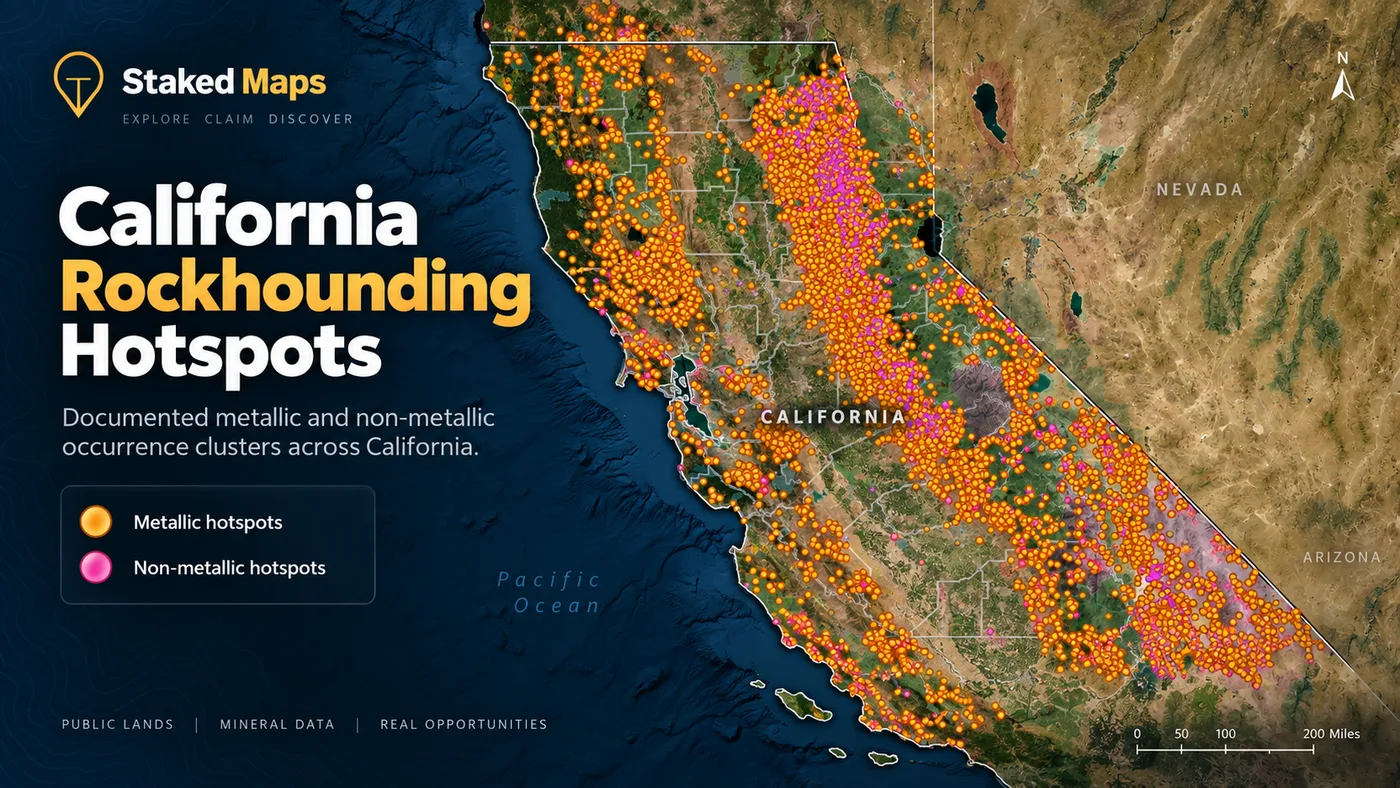
Staked Maps tracks 35,572 documented California mineral-occurrence records from the USGS Mineral Resources Data System (MRDS). These records can help identify areas with documented mineral history, but they are research leads — not a directory of verified public collecting sites.
A mineral occurrence is not permission to collect
A documented occurrence does not establish public access, current mineral availability, land ownership, permission to collect, or whether the location is inside an active mining claim or another restricted area. Always research the current land manager, claim status, access and collecting rules before visiting.
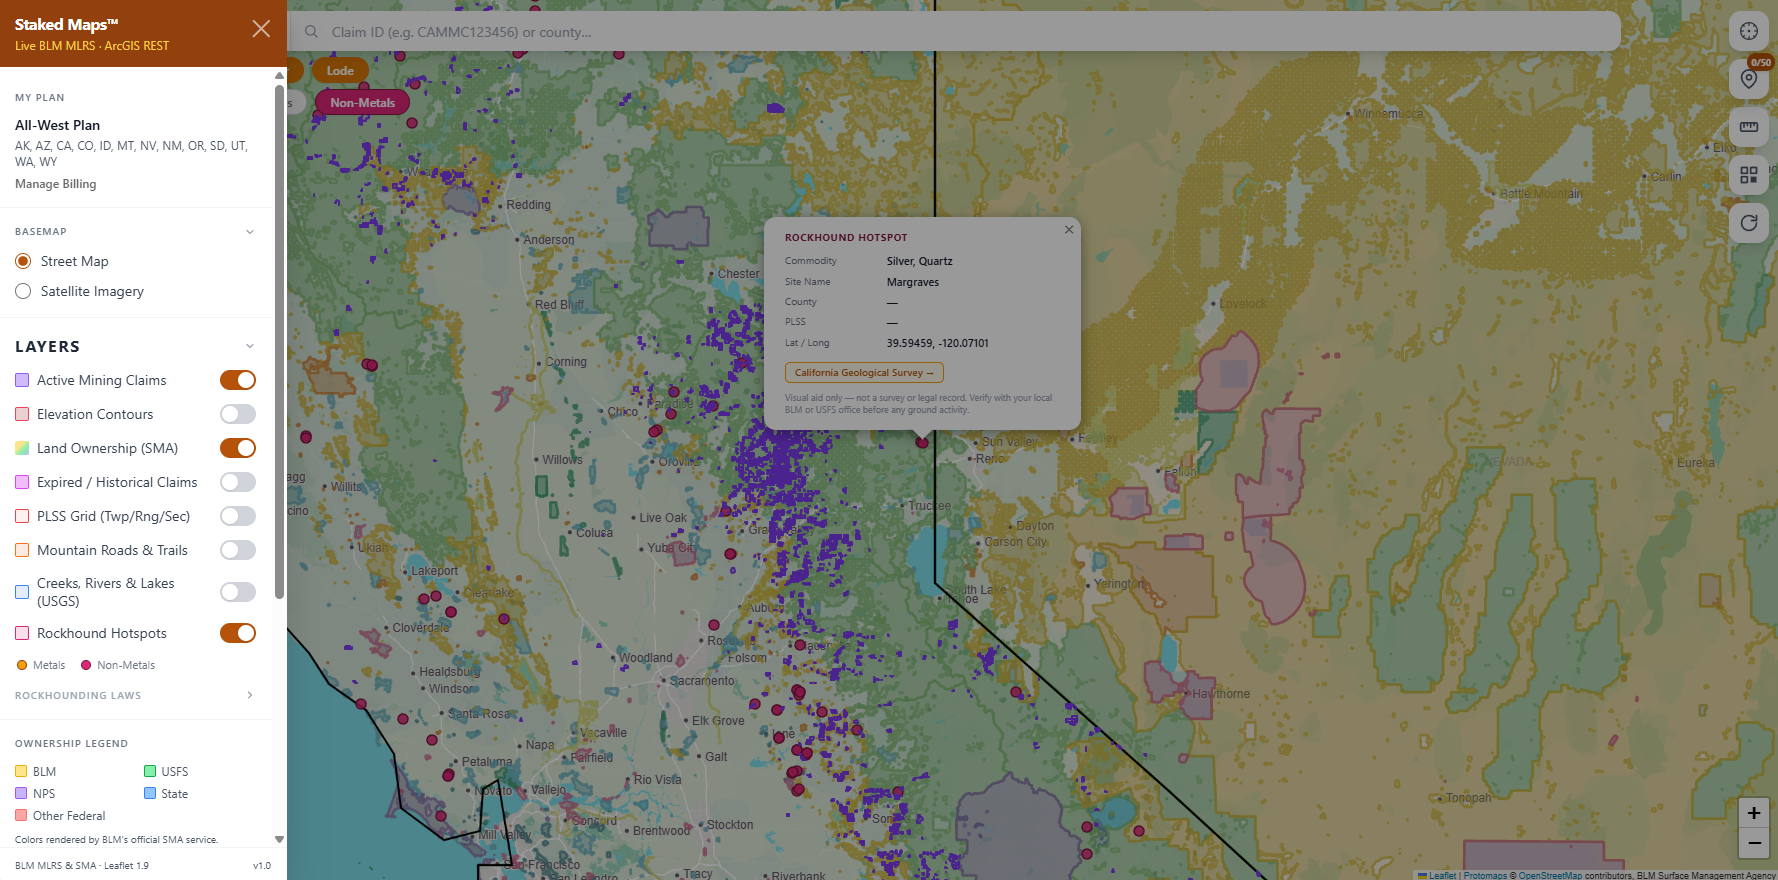
In the Staked Maps app, the Rockhound Hotspots layer uses these documented mineral-occurrence records as research leads. "Hotspot" is the layer name; it does not mean every mapped site is open or suitable for recreational collecting. On this page, Staked Maps uses Documented Mineral Occurrences as the factual dataset label for these 35,572 records.
Source records sometimes use broad or overlapping commodity labels; counts above preserve the underlying record classifications.
California Top Rockhounding Materials, Visualized
Material
Sites Recorded
Gemstone
180
Gemstone, Semiprecious
68
Quartz
35
Kyanite
20
Abrasive, Garnet
12
Abrasive, Corundum
4
How California's Mining History Shaped Today's Claim Map
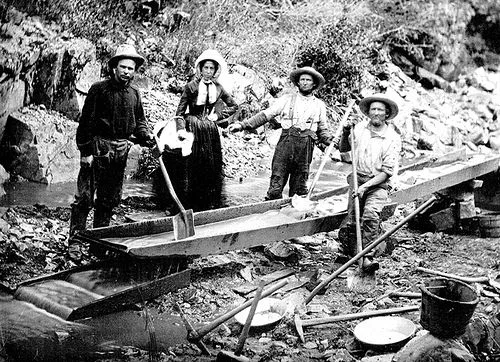
James W. Marshall's 1848 gold discovery at Sutter's Mill on the South Fork American River helped trigger the California Gold Rush and transformed the Sierra Nevada foothills into one of the best-known mining regions in the world. Placer mining expanded along rivers and ancient gravel deposits, while hard-rock mining developed around gold-bearing vein systems across the broader Mother Lode region.
Historical mining photograph. Wikimedia Commons, Public Domain. Three men and one woman panning for gold during the California Gold Rush, July 9, 1850.
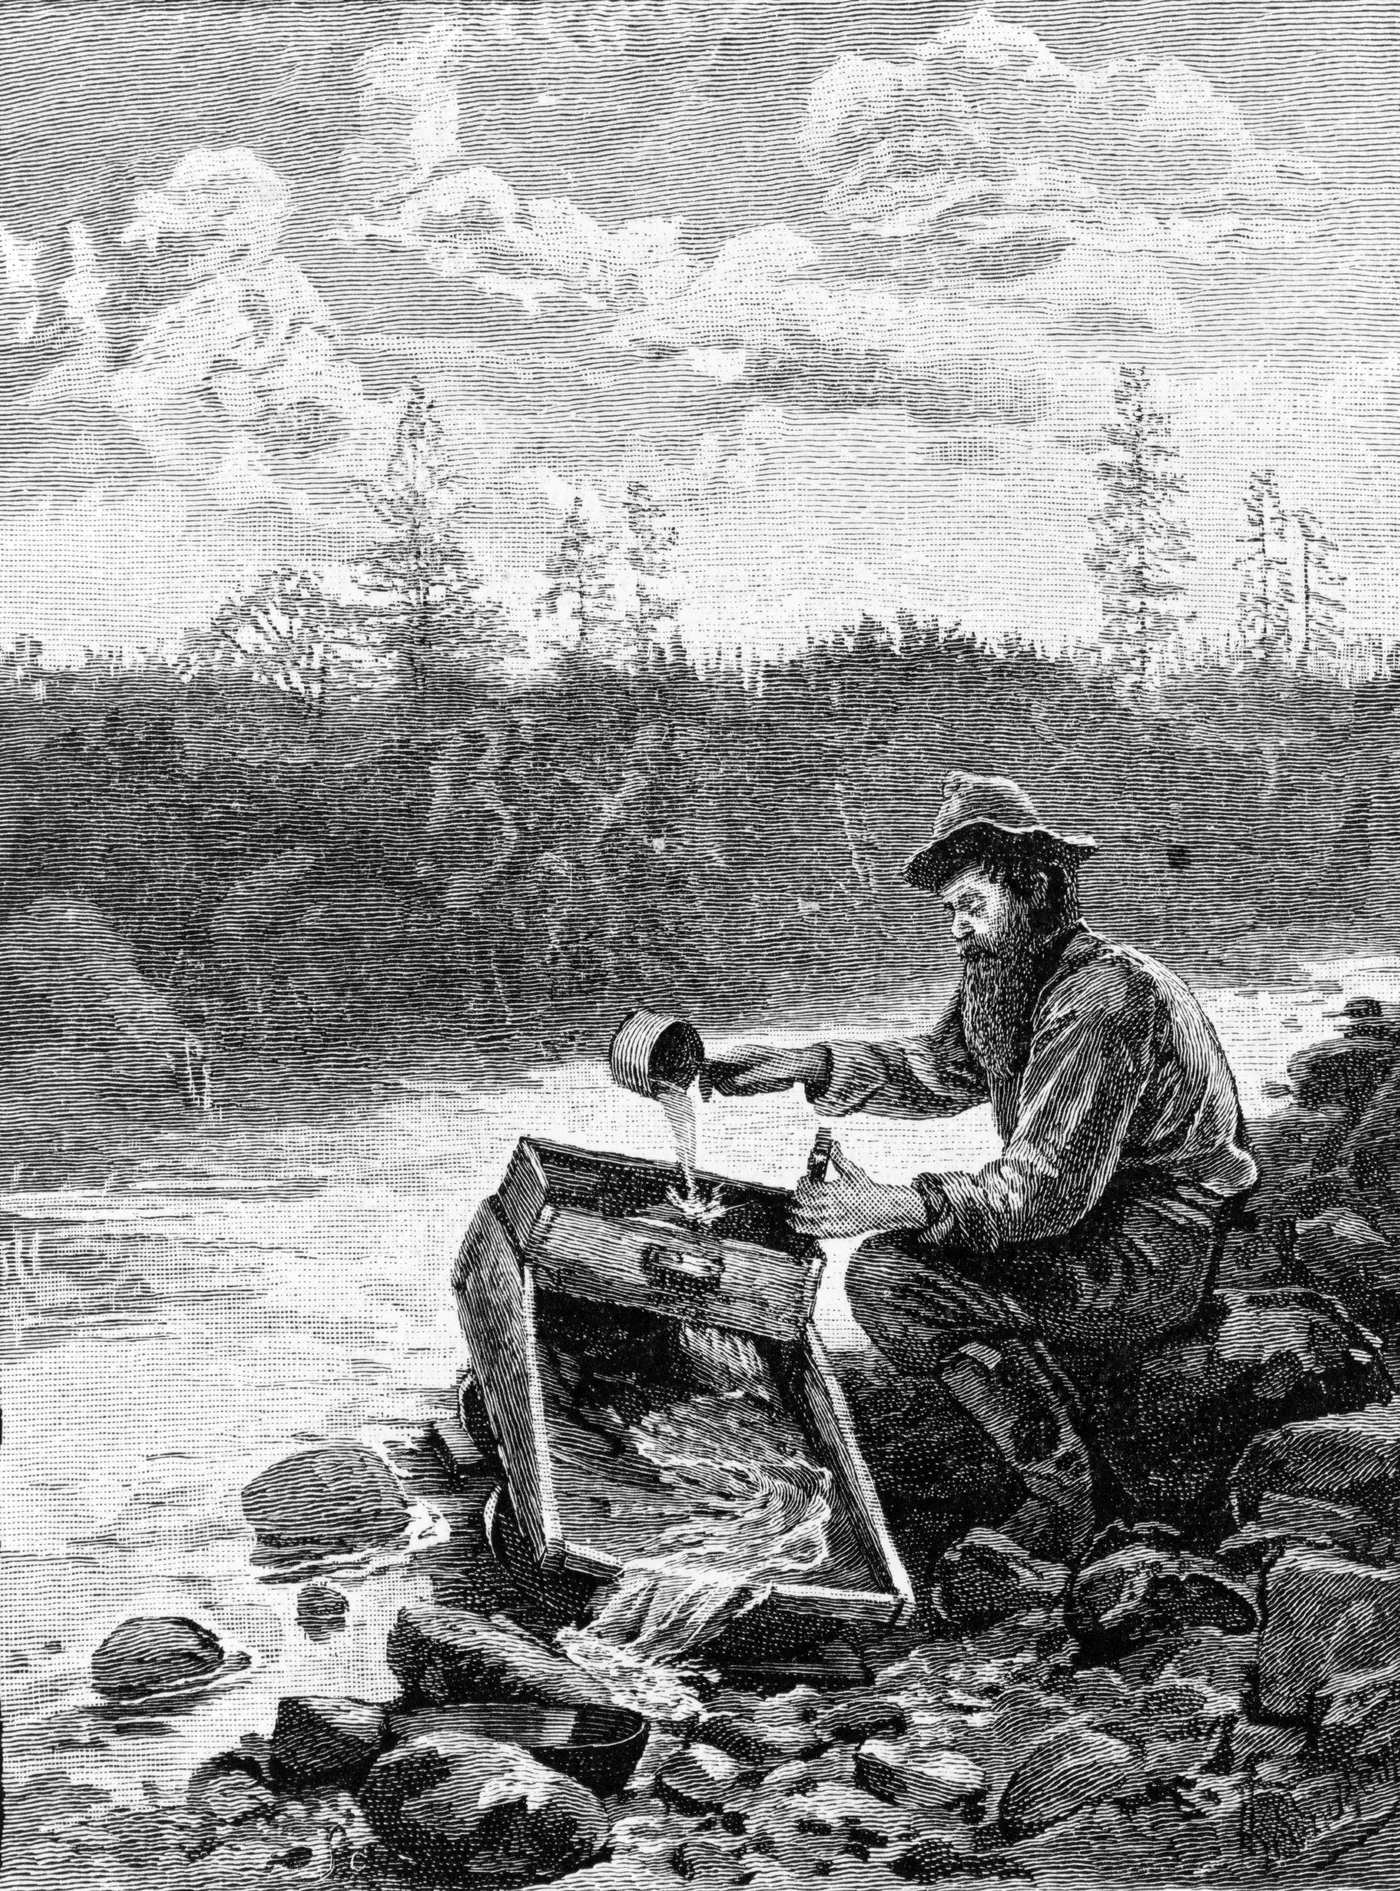
California mining did not remain confined to the Gold Rush foothills. Northern river districts, eastern mountain ranges, and Southern California desert districts all developed their own mining histories. That broader geography matters when looking at today's federal claim record.
Historical mining print. Wikimedia Commons, Public Domain. "The Cradle" by Henry Sandham, depicting hydraulic mining for gold in California. Published in The Century Illustrated Monthly Magazine, January 1883, p. 325.
The modern Staked Maps data above shows why historical reputation and current claim concentration should be treated as related but different questions. Historic districts can tell you where mining occurred; current BLM records tell you where federal claims and sites are recorded today. Neither, by itself, proves that a location is currently open to prospecting or available for a new claim.
Staked Maps' historical claim layer showing closed federal records alongside current claims.
Where Staked Maps Gets California Mining Claim Data
Staked Maps combines public federal and state research data into a single prospecting map. We keep the source of each dataset visible because mining records, surface management, mapped geometry, and mineral occurrences answer different questions.
Current mining claims and sites
Current federal mining claim and site records come from the Bureau of Land Management's Mineral & Land Records System (MLRS) and associated BLM data used by the Staked Maps synchronization pipeline. California current/not-closed statistics on this page are calculated from the same production records displayed by Staked Maps. Last synchronized: September 22, 2026.
Historical / closed claims
Historical claim information comes from BLM's closed-claims MLRS geospatial layer, synchronized into the Staked Maps historical-claims pipeline and cross-checked monthly against still-open records.
Mapped claim geometry
Claim polygons shown by Staked Maps are research geometry derived from recorded public-land descriptions and available federal geospatial information. They are not professional boundary surveys and must not be treated as survey-grade legal boundaries.
Surface management
Surface-management layers show the managing agency or mapped land category supplied by BLM's public surface-management geospatial data. Surface management does not by itself establish mineral ownership or whether land is open to prospecting or claim location.
Mineral occurrences
Documented mineral-occurrence data comes from the U.S. Geological Survey's Mineral Resources Data System (MRDS). These records document reported mineral occurrences, prospects and mines and are used as research leads rather than proof of current public collecting access.
California geology
Geological context on this page is supported by official California Geological Survey and federal geological resources rather than unsourced prospecting claims.
What Staked Maps Does Not Determine
Staked Maps does not independently determine:
whether land is legally open to mineral entry;
whether a mineral deposit is commercially valuable;
whether a claim has a legally sufficient discovery;
mineral ownership;
legal property or claim boundaries;
permission to cross private property;
permission to prospect or collect on another person's claim;
whether a specific activity requires a permit;
whether a mapped mineral occurrence is publicly accessible;
whether conditions have changed since the underlying agency last updated its record.
Use Staked Maps to narrow and organize your research. Use the appropriate BLM office, land manager, county records and current regulations to verify legal questions before acting on the information.
Official Prospecting Resources for California
Official California Mining & Prospecting Resources
Use for: Park-specific gold-panning and rockhounding regulations where those activities are permitted.
Frequently Asked Questions
Where does Staked Maps get its mining claim data?
Directly from the Bureau of Land Management's official MLRS (Mineral & Land Records System) case-recordation records, synced into our database on a regular schedule — not scraped or crowd-sourced.
What's the difference between active and historical claims?
Staked Maps displays the status reported by BLM. Records with a case disposition of Active are labeled Active; historical records come from BLM's closed-claims dataset. These statuses are research information, not a Staked Maps legal determination of claim validity, discovery, ownership or compliance. Verify the current record through MLRS before acting on it.
Can I search by claim number?
Free users can search by county. Paid plans add search by claim serial number, plus each claim's full legal (aliquot) description and BLM records link.
How many active mining claims are in California?
As of September 22, 2026, BLM records in Staked Maps show 13,883 California mining claim and site records with a case disposition of Active. Another 157 are Under Review, 14,783 are Filed, 15 are Submitted and 1 is Pending, bringing California's total current/not-closed federal claim and site records to 28,839. These database statuses are not a legal determination that an individual claim contains a valid mineral discovery.
What are Rockhound Hotspots?
A premium map layer of documented mineral occurrences, prospects and mines sourced from USGS MRDS and labeled by material where available. These records are research leads, not a directory of verified public collecting sites.
Where are most mining claims in California?
California's current federal mining-claim records are concentrated in a handful of counties. As of the data date above, San Bernardino County ranks first, followed by Inyo County and Imperial County. Together, those counties account for about 60% of California's current mapped claim/site records. Claim concentration indicates recorded mining activity, not whether adjacent land is open for prospecting or whether it has mineral potential.
Does the California map cover the whole state?
Yes. Staked Maps covers California statewide. Dedicated research pages are currently available for Nevada County, San Diego County, Siskiyou County, Kern County and El Dorado County, while the interactive map covers claims and surface management throughout California.
Which agency manages federal mining claims in California?
The Bureau of Land Management California State Office administers federal mining-claim records for California. California also has county recording requirements — new claims are generally filed with both the county recorder and BLM. See the Official California Mining & Prospecting Resources section above for direct links.
What is the difference between an Active and Filed BLM mining claim?
Active and Filed are statuses reported in BLM's claim records. Staked Maps preserves those reported statuses rather than combining every current record under the word "active." A BLM record status is useful research information, but it should not be interpreted as a Staked Maps legal determination about discovery, ownership, compliance or validity.
Is gold panning legal in California?
Gold panning can be allowed in California, but there is no blanket rule that makes panning legal everywhere. Land ownership, land manager, mining claims, closures, environmental rules and site-specific regulations all matter. Some California State Parks allow panning only in designated areas under specific "hands and pans" rules, while federal lands have their own requirements. Check the rules for the exact location before panning.
Is suction dredging legal in California?
No. The California Department of Fish and Wildlife currently states that vacuum or suction dredging is prohibited and unlawful throughout California, and CDFW is currently prohibited from issuing suction-dredging permits under the Fish and Game Code.
Can I prospect on BLM land in California?
Sometimes, but BLM-managed surface land is not automatically open to every form of prospecting or mining. You must consider mineral ownership, existing mining claims, withdrawals, special designations, activity-specific regulations and other restrictions. BLM states that mining claims may be located only where the federal mineral estate is open to mineral entry.
If no mining claim appears on the map, can I stake one there?
Not necessarily. An apparent gap between recorded claims does not prove that land is open to mineral entry. The area could be withdrawn, closed, privately owned, subject to different mineral ownership, affected by another right or restriction, or represented incompletely in the underlying public record. Verify the current federal land and mineral status before attempting to locate a claim.
Can I collect rocks and gemstones on California BLM land?
BLM California generally allows qualifying rocks, minerals and semiprecious gemstones to be collected for personal, noncommercial use where collecting is not otherwise prohibited or restricted. The agency currently defines California's reasonable personal-use limit as up to 25 pounds per day plus one piece, with a maximum of 250 pounds per year. Special areas and specific resources can have different restrictions, so check the location before collecting.
Are Staked Maps claim polygons legal property boundaries?
No. Staked Maps claim polygons are research and mapping aids, not professional land surveys or legal boundary determinations. Always rely on official records, recorded location documents, monuments on the ground where applicable, and qualified professional assistance when legal boundary accuracy matters.
Research California Before You Head Into the Field
California's mining history is famous. Its current claim landscape is much more complicated. Use Staked Maps to bring current claim records, historical activity, surface-management context and mineral research into one map before deciding where to investigate next.
Single State, Tri-State and All-West all unlock the exact same features — nothing is pay-gated between them, they differ only in how many states you get.
Paid plans renew automatically at the monthly or annual rate you choose until you cancel. Cancel anytime and keep access through the end of your paid period. See our Terms of Use.
Single State, Tri-State and All-West unlock the identical feature set — only the number of states differs.
National Rockhound Pass is a separate, nationwide-but-lighter product built for rockhounds outside the core mining states.
Free
Single State
Tri-State
All-West
Rockhound Pass
Geographic coverage
1 state (view only)
1 state, full data
3 states, full data
13 Western states, full data
All 50 states, safety layer only
Interactive claims map, basemaps, compass, county search
✓
✓
✓
✓
✓
Surface management (public/private land) overlay
✓
✓
✓
✓
✓
Claim type, name, status & size in popups
✓
✓
✓
✓
✓
Full legal location (aliquot description)
✕
✓
✓
✓
✕
Claim serial number, owner intel, BLM Records & 'Directions' button
✕
✓
✓
✓
✕
Search by claim number
✕
✓
✓
✓
✕
Custom pins & distance measure tool
✕
✓ (up to 50)
✓ (up to 50)
✓ (up to 50)
✓
Expired & historical claims layer
✕
✓
✓
✓
✕
Placer/Lode claim filters & latest synchronized data
Information hosted on Staked Maps is compiled from publicly available data
streams provided by the Bureau of Land Management (BLM) and relevant state
geographic clearinghouses. Staked Maps accepts no liability for the content of
this geospatial data, or for the consequences of any real-world exploration,
land entry, or staking actions taken on the basis of the information provided
via this application interface.
Staked Maps makes no warranty, expressed or implied, including the warranties of
merchantability and fitness for a particular purpose, nor assumes any legal
liability or responsibility for the pinpoint accuracy, reliability, completeness,
latency, or programmatic utility of these geospatial data layers, or for the
improper interpretation of these data grids.
These mapping layers and related graphics are visual convenience aids only; they
are not legal documents and must never be used as such. The data may not be used
to legally determine title, mineral ownership, valid description boundaries,
jurisdictional authorities, or land restrictions in place on public or private
land. Natural backcountry hazards may or may not be depicted on topographies, and
land users are strictly mandated to exercise caution. Federal records are dynamic
and change constantly. The end-user is exclusively responsible for validating
current land classifications with local BLM field offices and managing compliance
accordingly.